Percepts and Concepts Laboratory
Complex Adaptive Systems Outreach
The Chaos Game
 |
 |
 |
 |
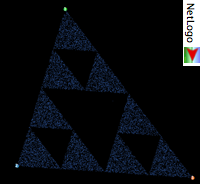
This is a computer simulation of "The Chaos Game." This simulation obeys the following rules:
1. A set of endpoints are designated, and an initial location for a moving point is selected.
2. One of the endpoints is randomly selected. Usually, each endpoint is equally likely to be chosen.
3. The NEW location for the moving point will (usually) be halfway between its OLD location and the chosen endpoint. This NEW location is plotted on the screen as a point, and then becomes the OLD location.
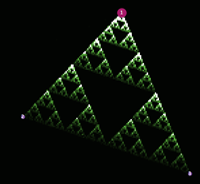
Imagine what happens if we designate three endpoints so as to form an equilateral triangle, and repeat Steps 2 and 3 a large number of times. One might think that the plotted points will randomly fill in the area between the endpoints. Nothing could be further from the truth! In fact, the resulting plot is highly similar to a figure known as Sierpinski's gasket (see below). This is quite suprising given the completely random method for moving the plotted point. Most of the regions of the triangle are never covered by any plotted point, even if we repeat Steps 2 and 3 an INFINITE number of times. Sierpinski's gasket can be created by starting with a triangle and deleting an inverted triangle from its middle, resulting in three triangles each with an area 1/4 that of the larger triangle. This same operation is then applied to each of the three new triangles, creating 9 new triangles, and so on. Of course, this is not how "The Chaos Game" produces this same fractal pattern. This is a fractal pattern because it is self-similar at different spatial scales. The complete Sierpinski's gasket is infinitely complicated, and the same configurations one sees at a global level are repeated exactly at more and more detailed levels.
The main puzzle to try to solve with this simulation is: Why does the random procedure for moving points from time to time produce Sierpinski's gasket? With a bit of exploration and thought, you can probably figure out the reason. To help you, we have provided a feature that allows you to plot a point, and click on endpoints to simulate how the point would move if the endpoint was chosen. Once you understand the behavior of the system, a more challenging question is to try to determine the AREA of the plotted region as the number of iterations goes to infinity.